A finance dashboard from your profit and loss or budget file.
Export your P&L or budget as CSV or Excel. Daized reads revenue, cost of goods sold, operating expenses, EBITDA, budget and actuals, and builds the dashboard around them.
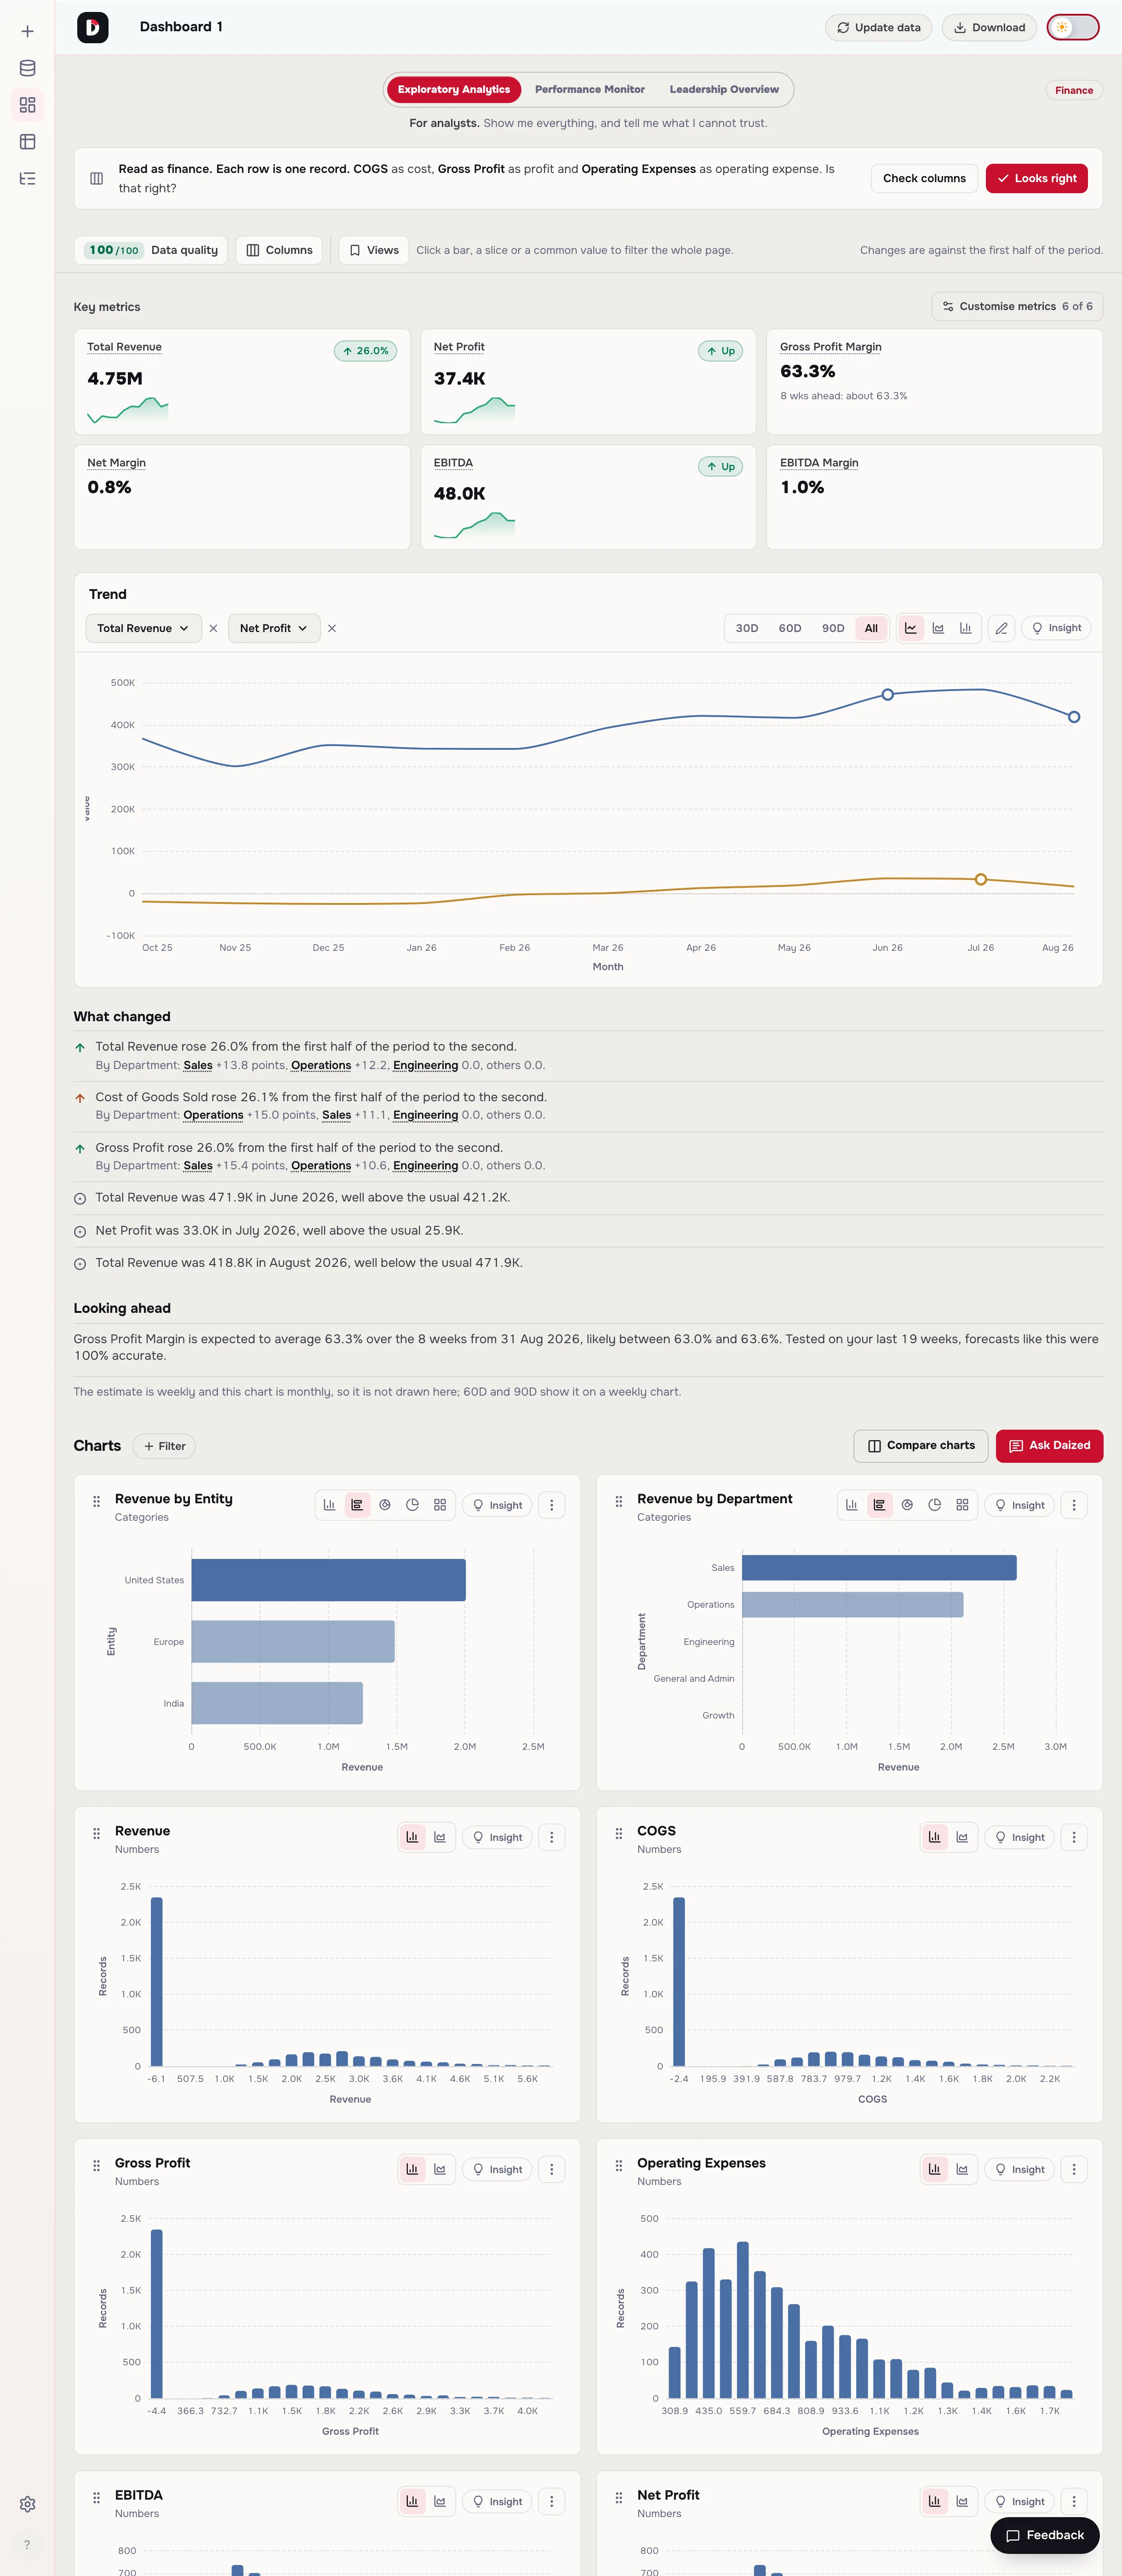
What Daized builds from a finance file
From the sample file, these were the key metrics it put first.
- Total Revenue
- Net Profit
- Gross Profit Margin
- Net Margin
- EBITDA
- EBITDA Margin
Below them: a trend you can switch between lines and bars, a written “What changed” that names the biggest driver, and “Looking ahead”, which appears only when the forecast passes a test on your own history and shows its score. Every other column worth charting gets a chart of its own, and clicking a bar filters the whole page.
“Total Revenue rose 26.0% from the first half of the period to the second.”
How it reads your file
It tells you how it read each column before you rely on the dashboard, and you can correct it.
On the sample file it wrote: “Read as finance. Each row is one record. COGS as cost, Gross Profit as profit and Operating Expenses as operating expense. Is that right?”
- Montha date, so every metric can be followed over time
- Entity, Departmentways to split the numbers and find where a change came from
- Revenuethe top line, used for every margin
- COGS, Gross Profitread as cost and profit, used for gross profit margin
- Operating Expenses, EBITDA, Net Profitused for operating expenses, EBITDA and net margin
- Budget, Actual, Variancein a budget report, used to show actual against budget
Questions
- What does my file need to look like?
- A CSV or Excel file with a header row and one row per period and entity or department, up to 100 MB. Column names do not have to match the ones above: Daized reads the values as well as the names, and tells you how it read each one.
- Do I have to set anything up?
- No. There is no data model to build, no formulas to write and nothing to prompt. You upload the file and the dashboard is built from it.
- Are the numbers calculated, or written by an AI?
- Calculated, in code, from your file. A written explanation only describes numbers the code already produced, and each one is labelled as written or computed.
- How long is my file kept?
- The table from your upload is kept for 30 days after you last open it, and you can delete a dataset yourself at any time. Read exactly what is stored.
- What does it cost?
- It is free to try. See the plans.