Every file has a story.Daized tells it first.
DAIZED walks into your numbers, works out what your business does, and comes back with what moved, why it moved and what happens next. Before you have asked a single question.
Free to start. No card needed.
- prompts to write
- 0prompts to write
- views, one per reader
- 3views, one per reader
- from file to dashboard
- ~1 minfrom file to dashboard
Three steps. You only do the first.
- 1
Drop the file in
CSV or Excel, as it is. Odd headers and title rows are fine.
- 2
It reads the business
Every column typed, the industry recognised, the right metrics chosen.
- 3
Your dashboard is ready
Charts, trends, what changed and what comes next, in plain sentences.
It already knows what your numbers mean.
Metrics for your industry, not a blank canvas
It recognises 35+ kinds of business from the columns alone, and computes what each is measured by: margin for sales, attrition for HR, occupancy for hotels. No setup, no formulas.
What moved, why, and what comes next
Every change is said in a sentence, with the category that drove it. Unusual weeks are marked, and a forecast appears only when it has passed a test on your own data.
Why Daized
Chat tools make you write the questions. BI tools make you build the answers. Daized does the deciding a good analyst would, the same way every time, and shows its working.
| Topic | Chat AI tools | BI tools | DAIZED |
|---|---|---|---|
| Getting a dashboard | Two to four rounds of prompting | Model the data, then build each chart | Ready on upload, in about a minute |
| What comes first | Whatever you thought to ask | Whatever you placed on the canvas | Key metrics first, then what changed, then detail |
| Different readers | One answer for everyone | Permissions, but the same view | Analyst, manager and leadership views |
| Same file, same answer | Varies by model, plan and prompt | Yes, once someone has built it | Yes, every number is computed in code |
| Setup | None, but you write every prompt | A data model and someone who knows the tool | None. Drop the file in as it is |
- Getting a dashboard
Chat AI tools: Two to four rounds of prompting
BI tools: Model the data, then build each chart
Daized: Ready on upload, in about a minute
- What comes first
Chat AI tools: Whatever you thought to ask
BI tools: Whatever you placed on the canvas
Daized: Key metrics first, then what changed, then detail
- Different readers
Chat AI tools: One answer for everyone
BI tools: Permissions, but the same view
Daized: Analyst, manager and leadership views
- Same file, same answer
Chat AI tools: Varies by model, plan and prompt
BI tools: Yes, once someone has built it
Daized: Yes, every number is computed in code
- Setup
Chat AI tools: None, but you write every prompt
BI tools: A data model and someone who knows the tool
Daized: None. Drop the file in as it is
- Recognises
0+0+ business domains. - Computes
0+0+ metrics. - Opens
00 file formats.
dashboards generated so far
One upload, a whole dashboard.
Five sample files, five dashboards, exported from the product as they are. Pick an industry, or let them turn.
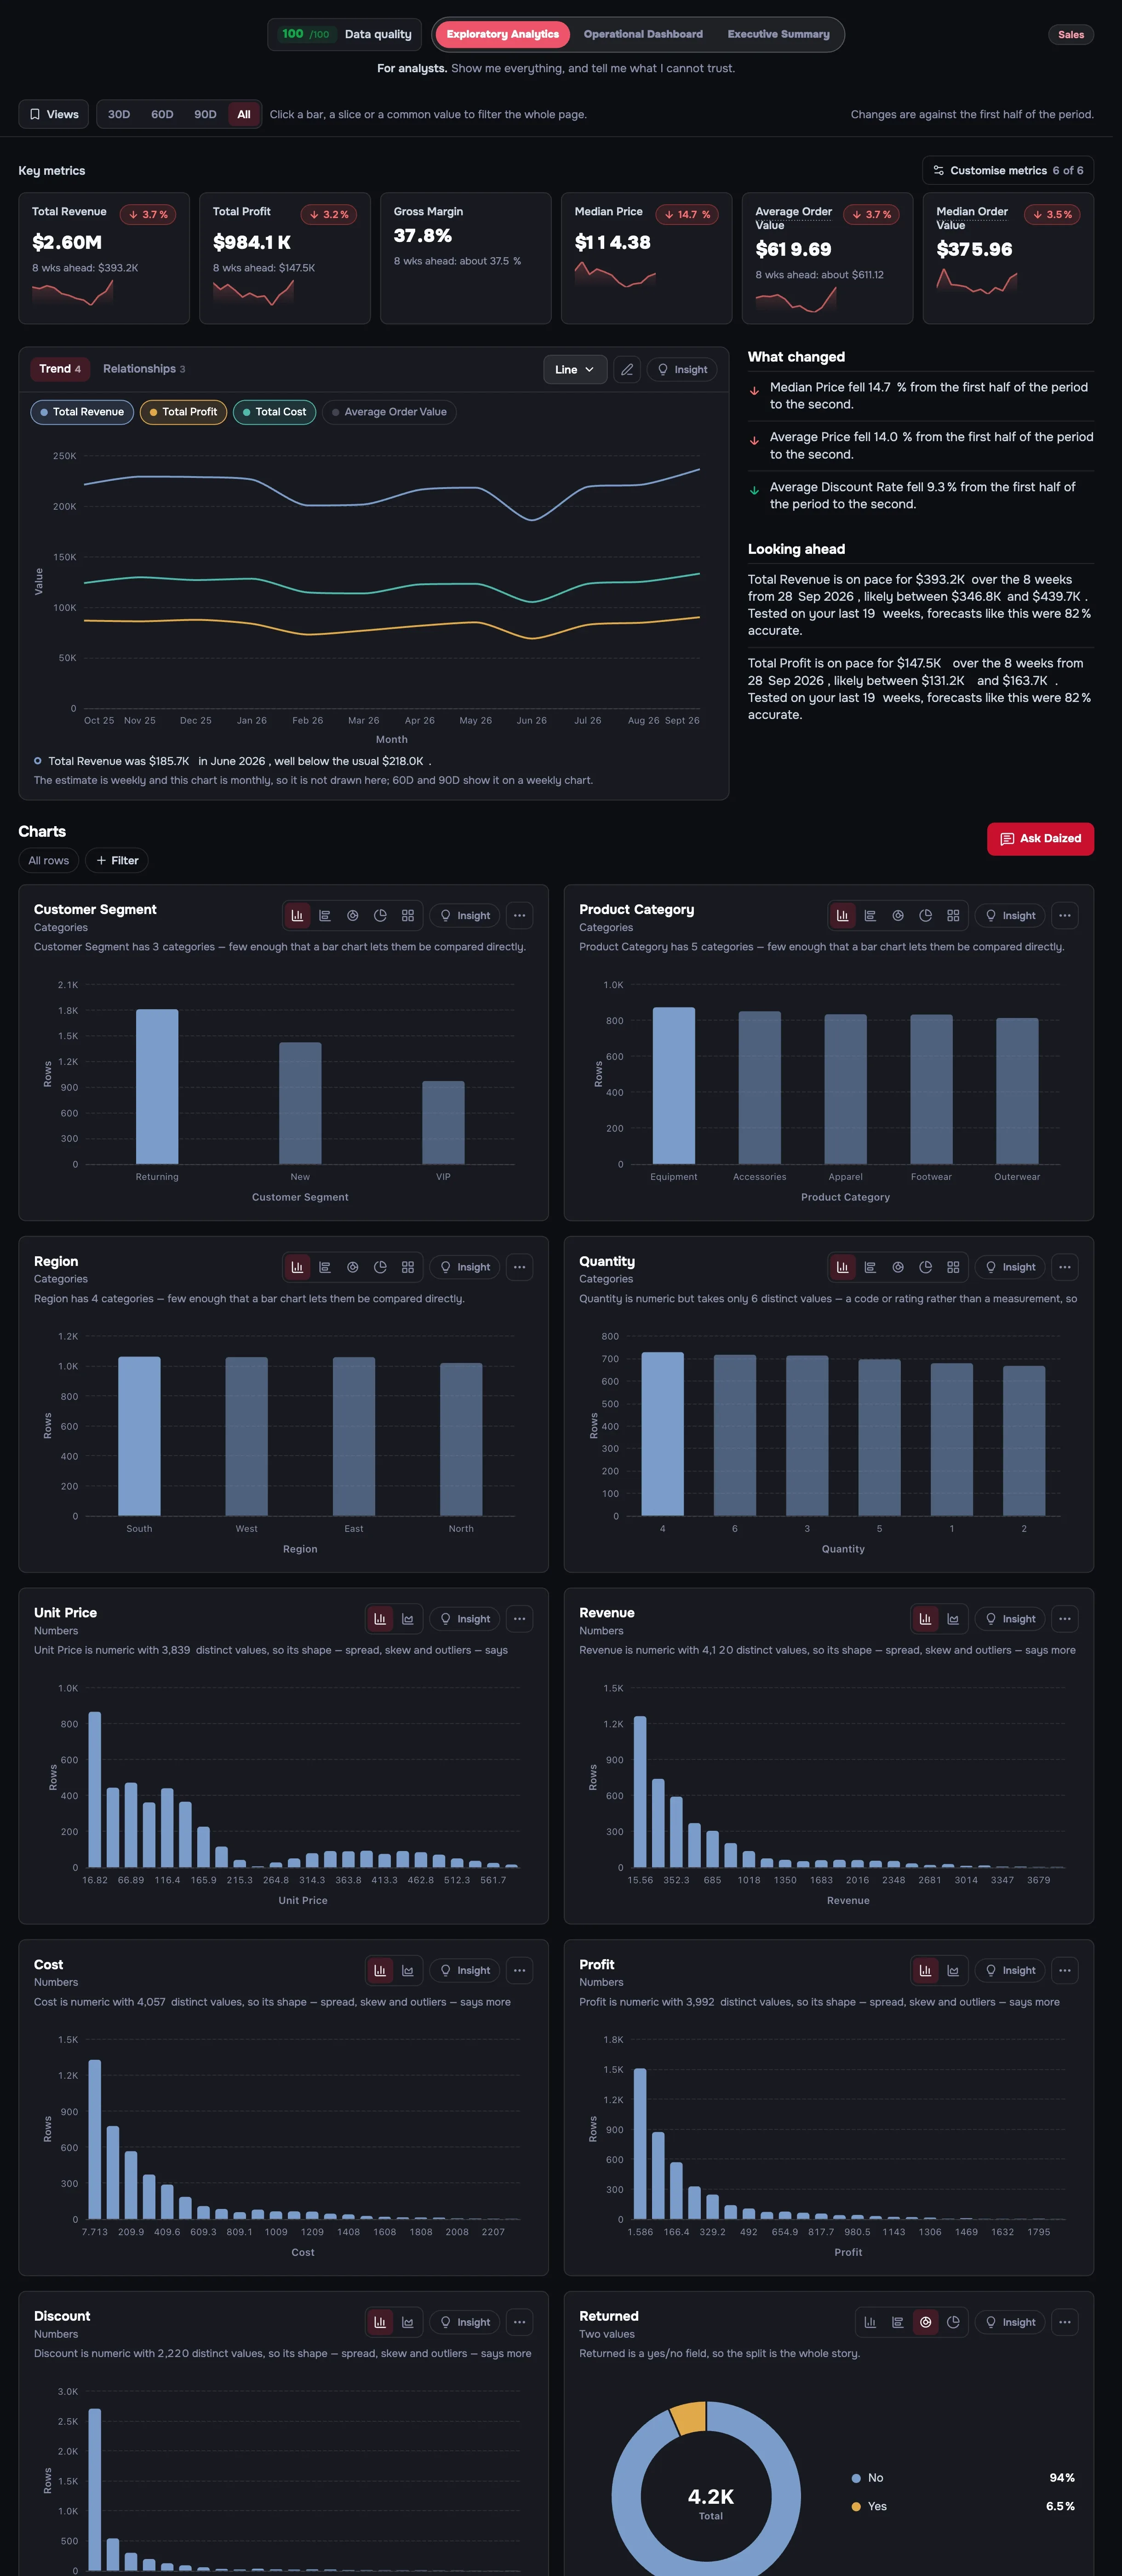
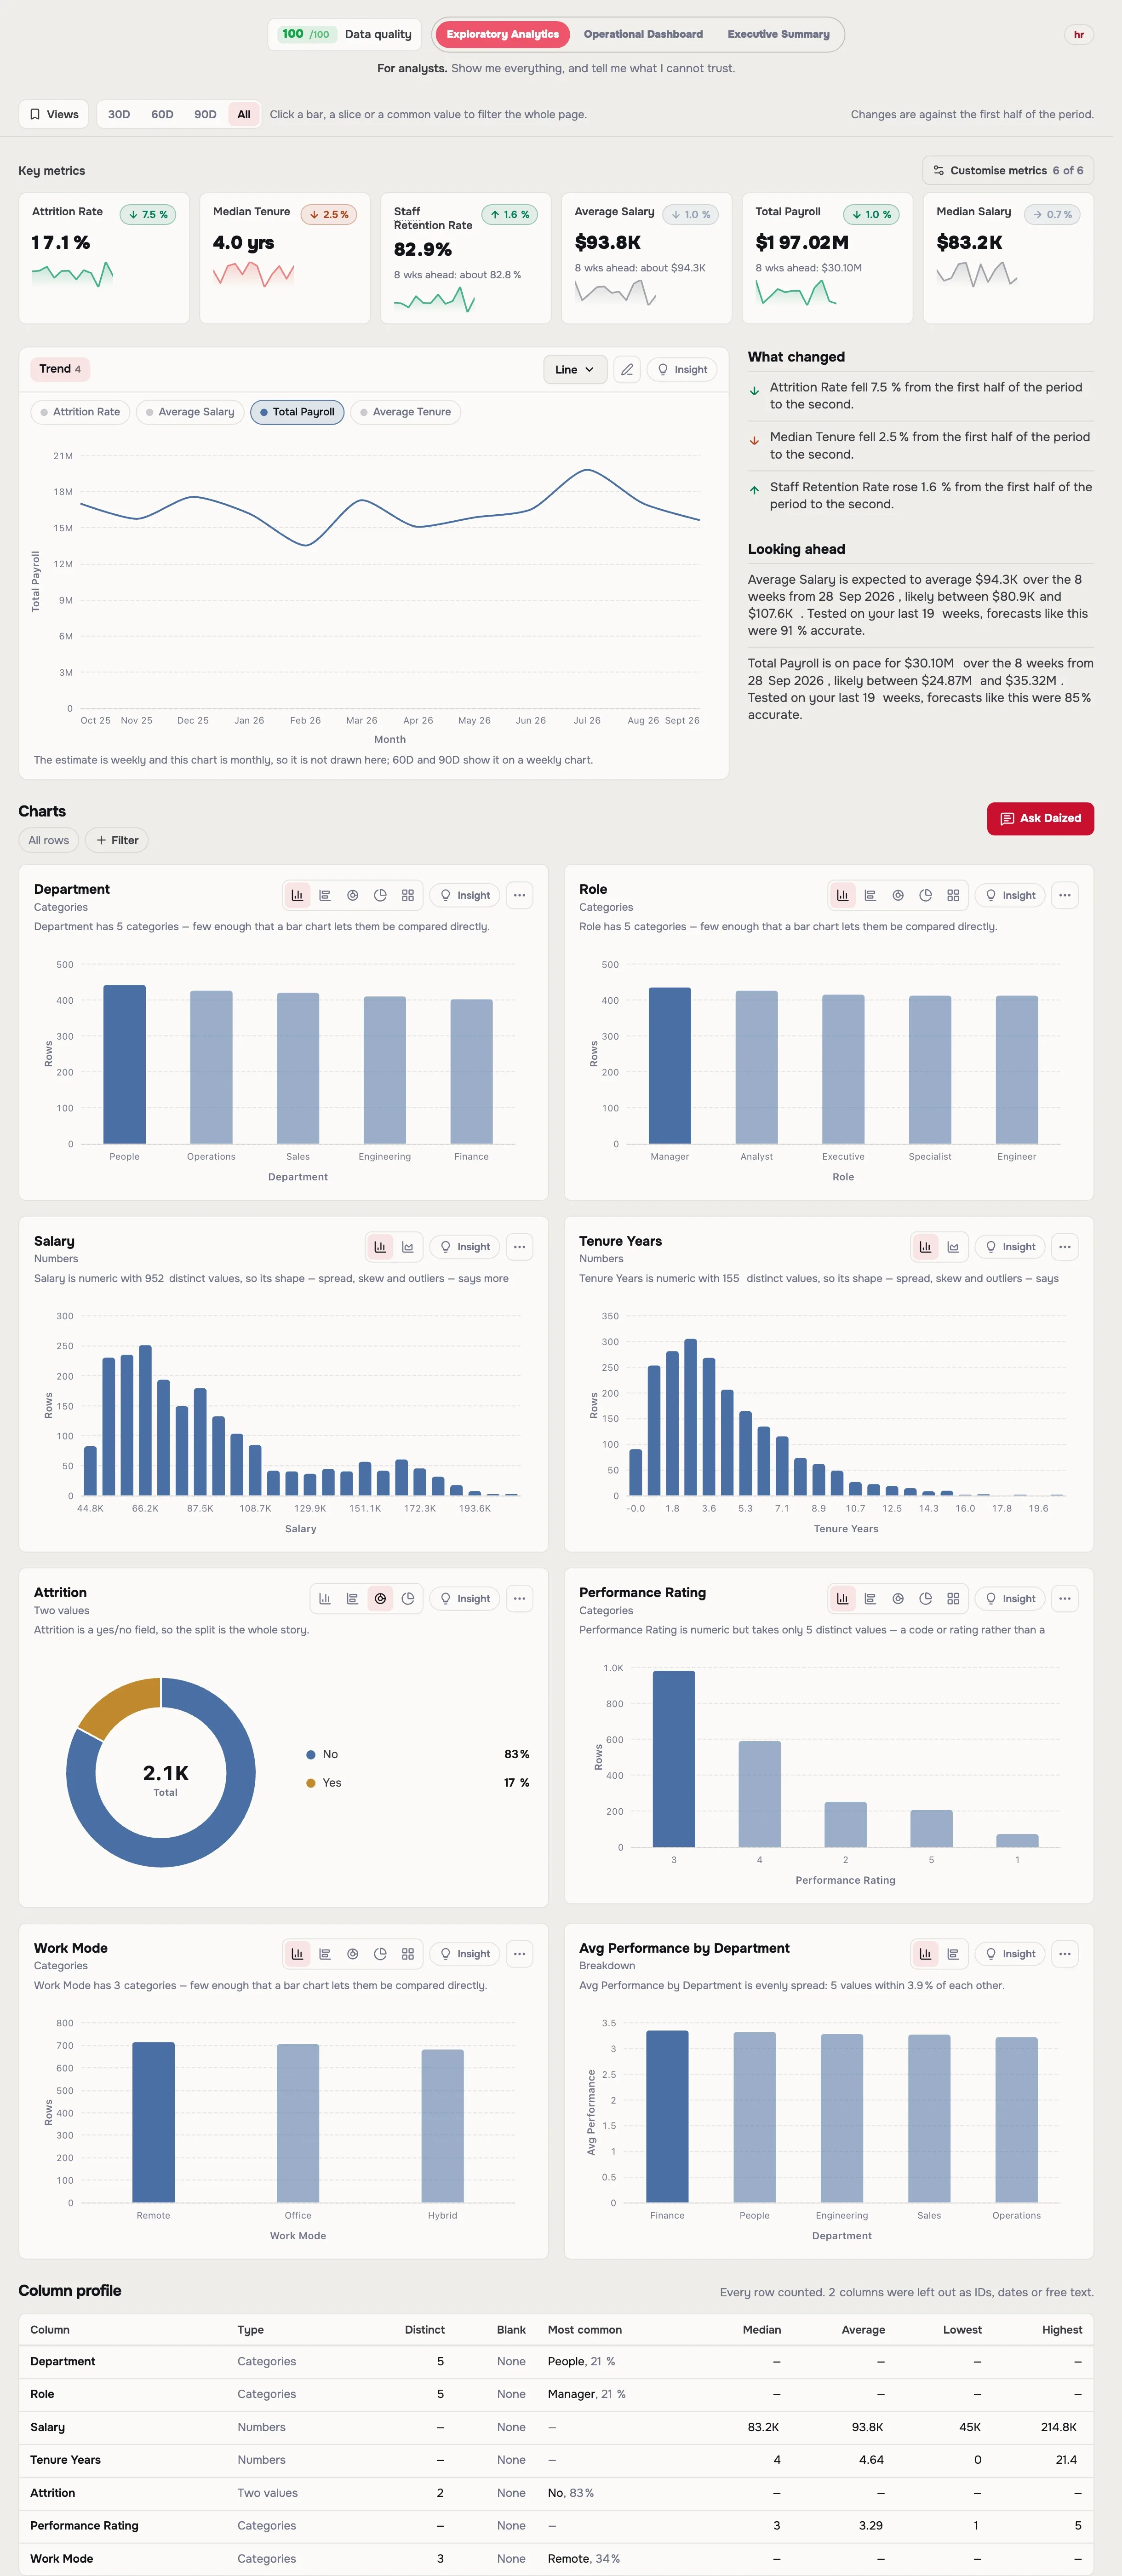
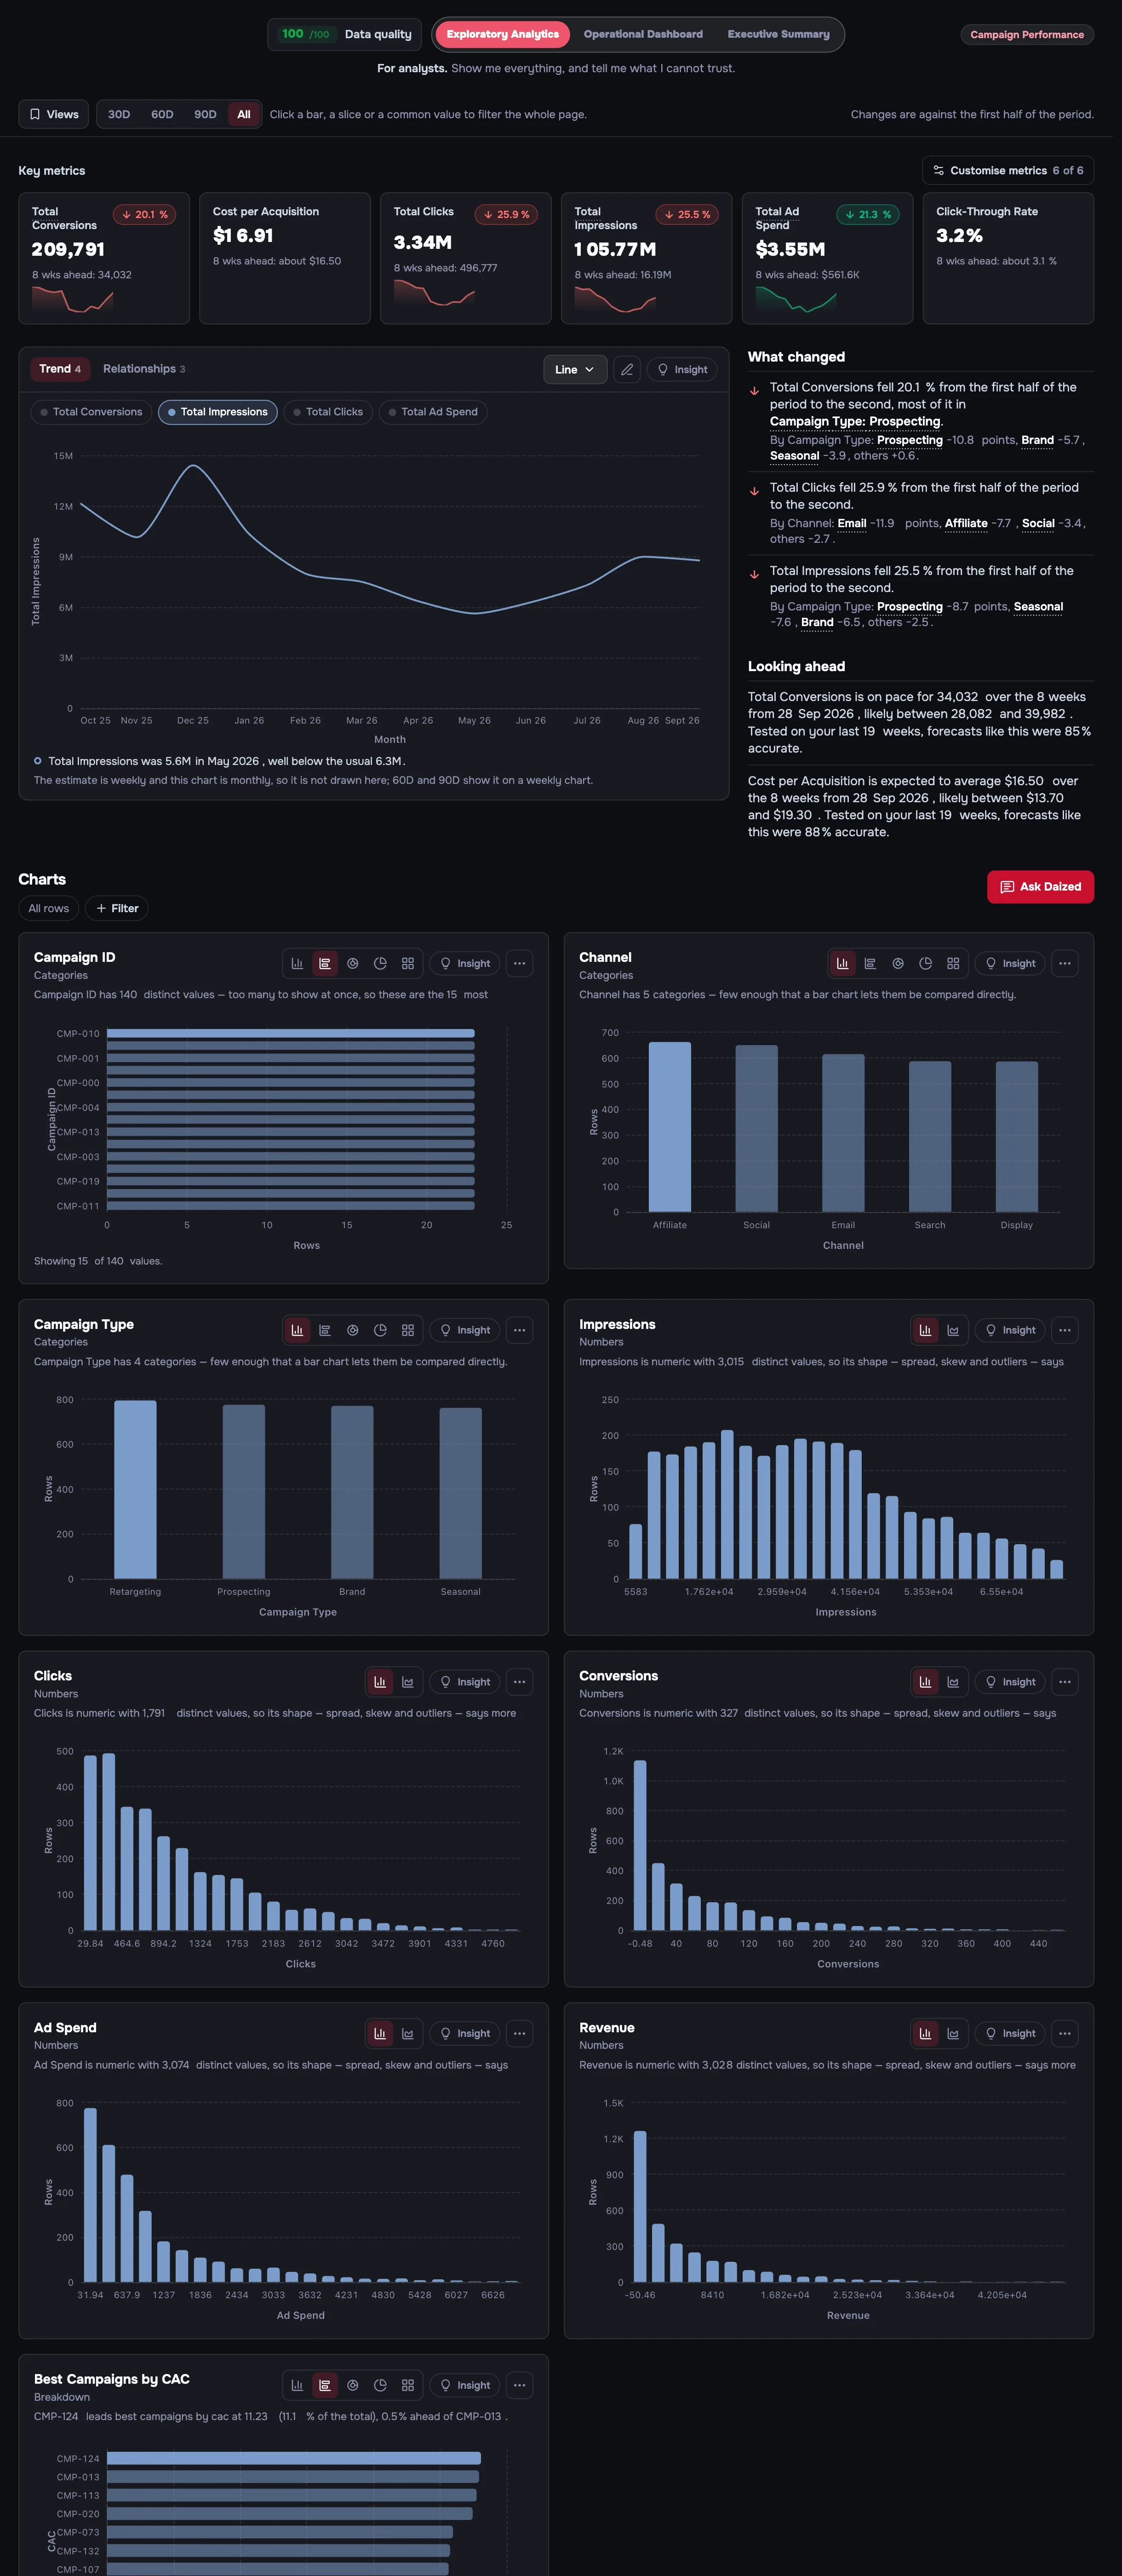
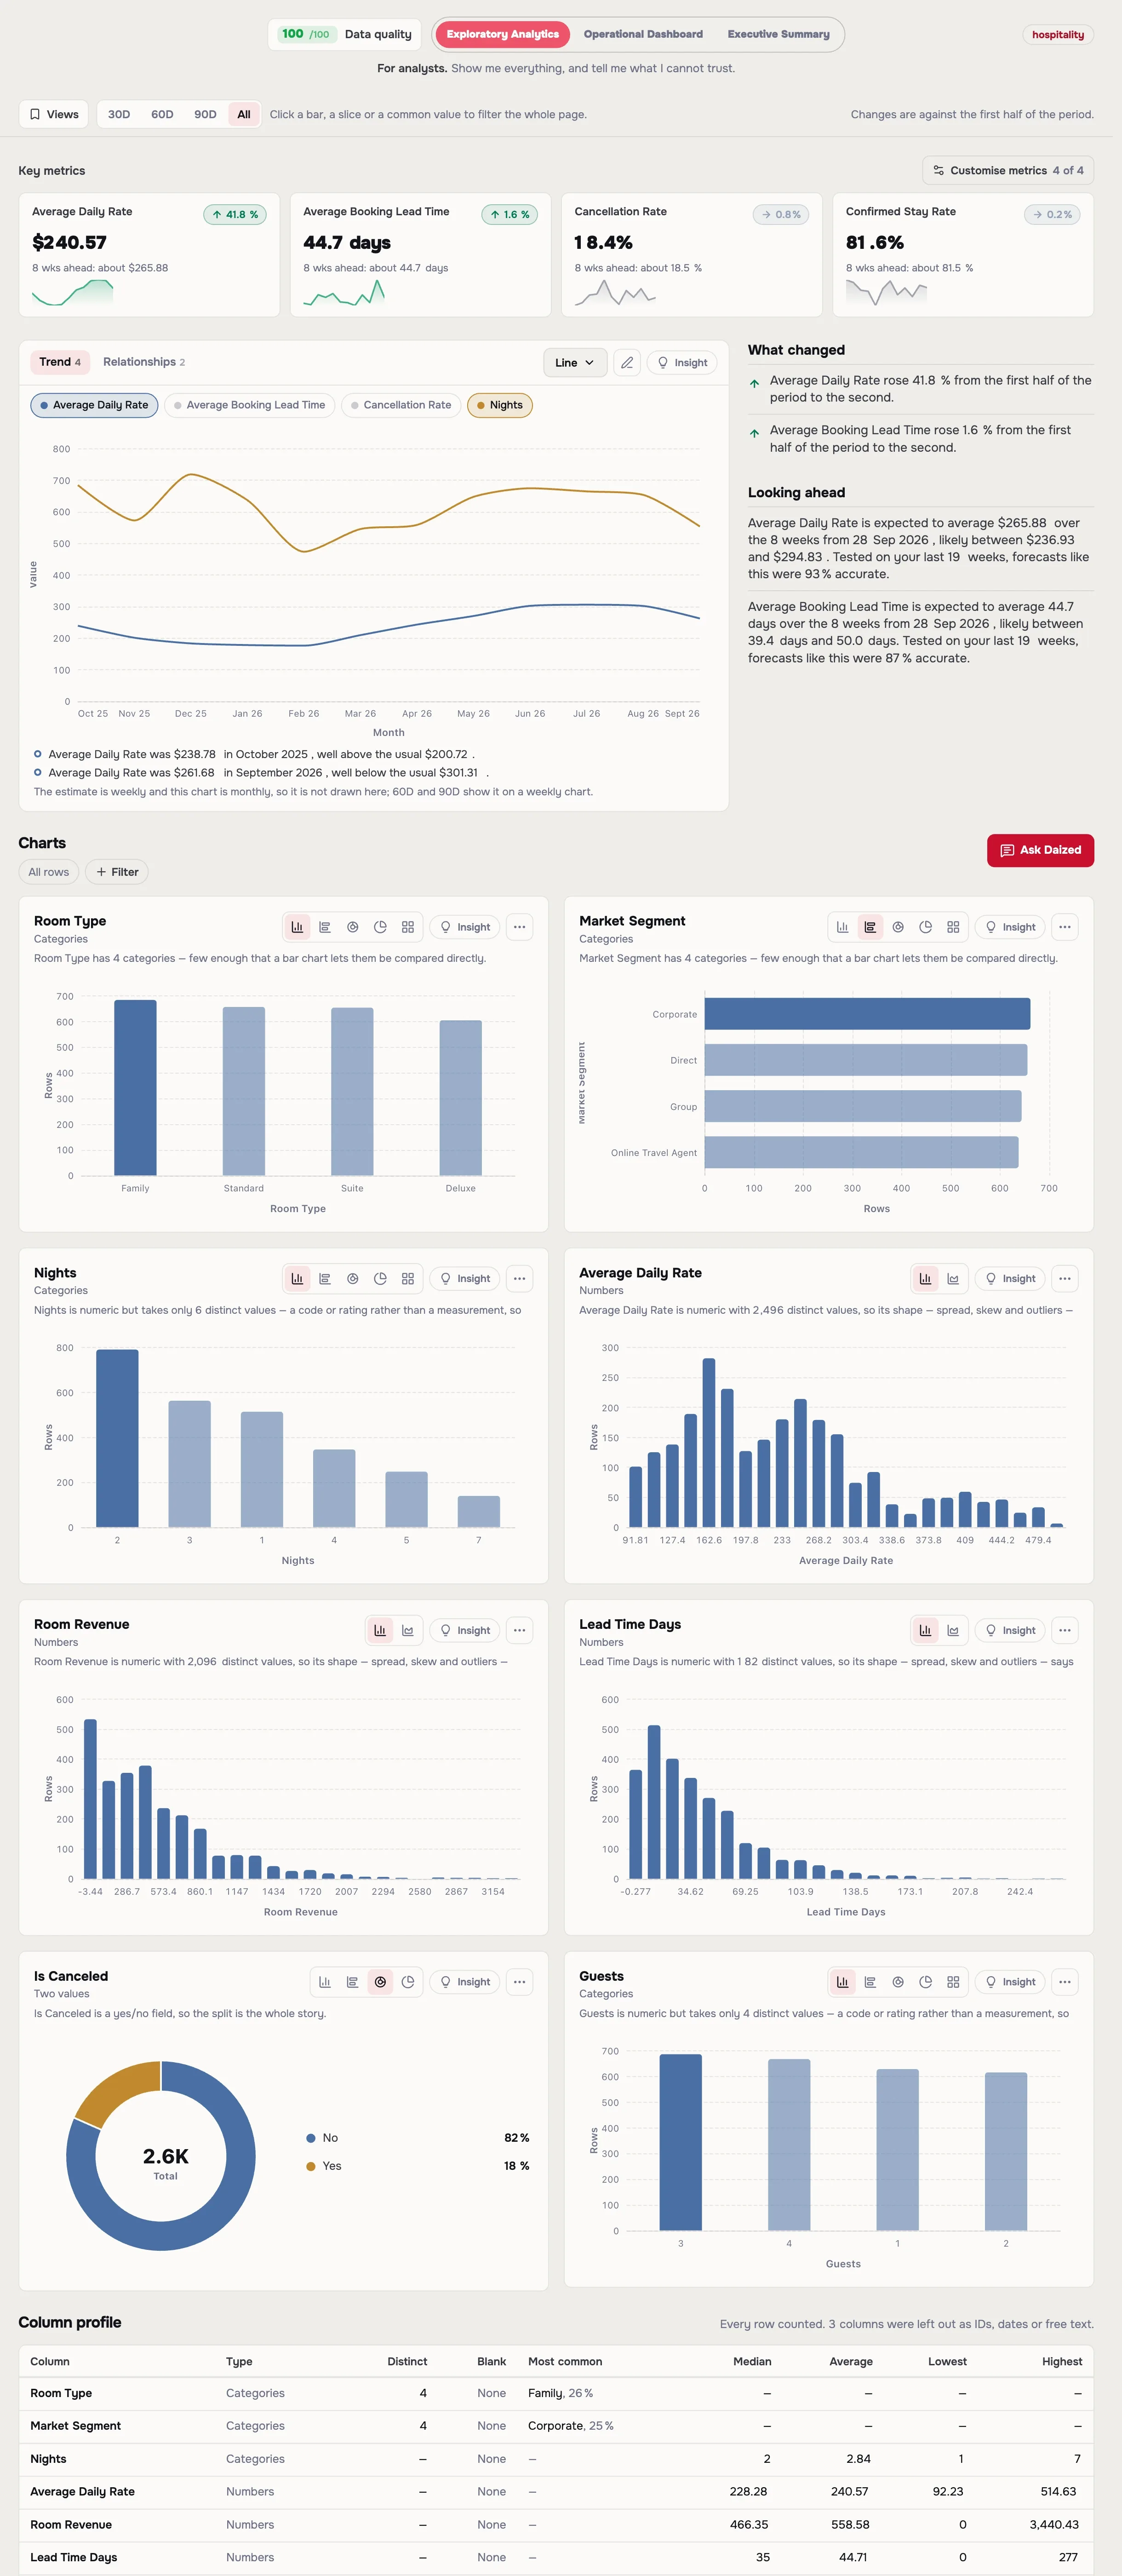
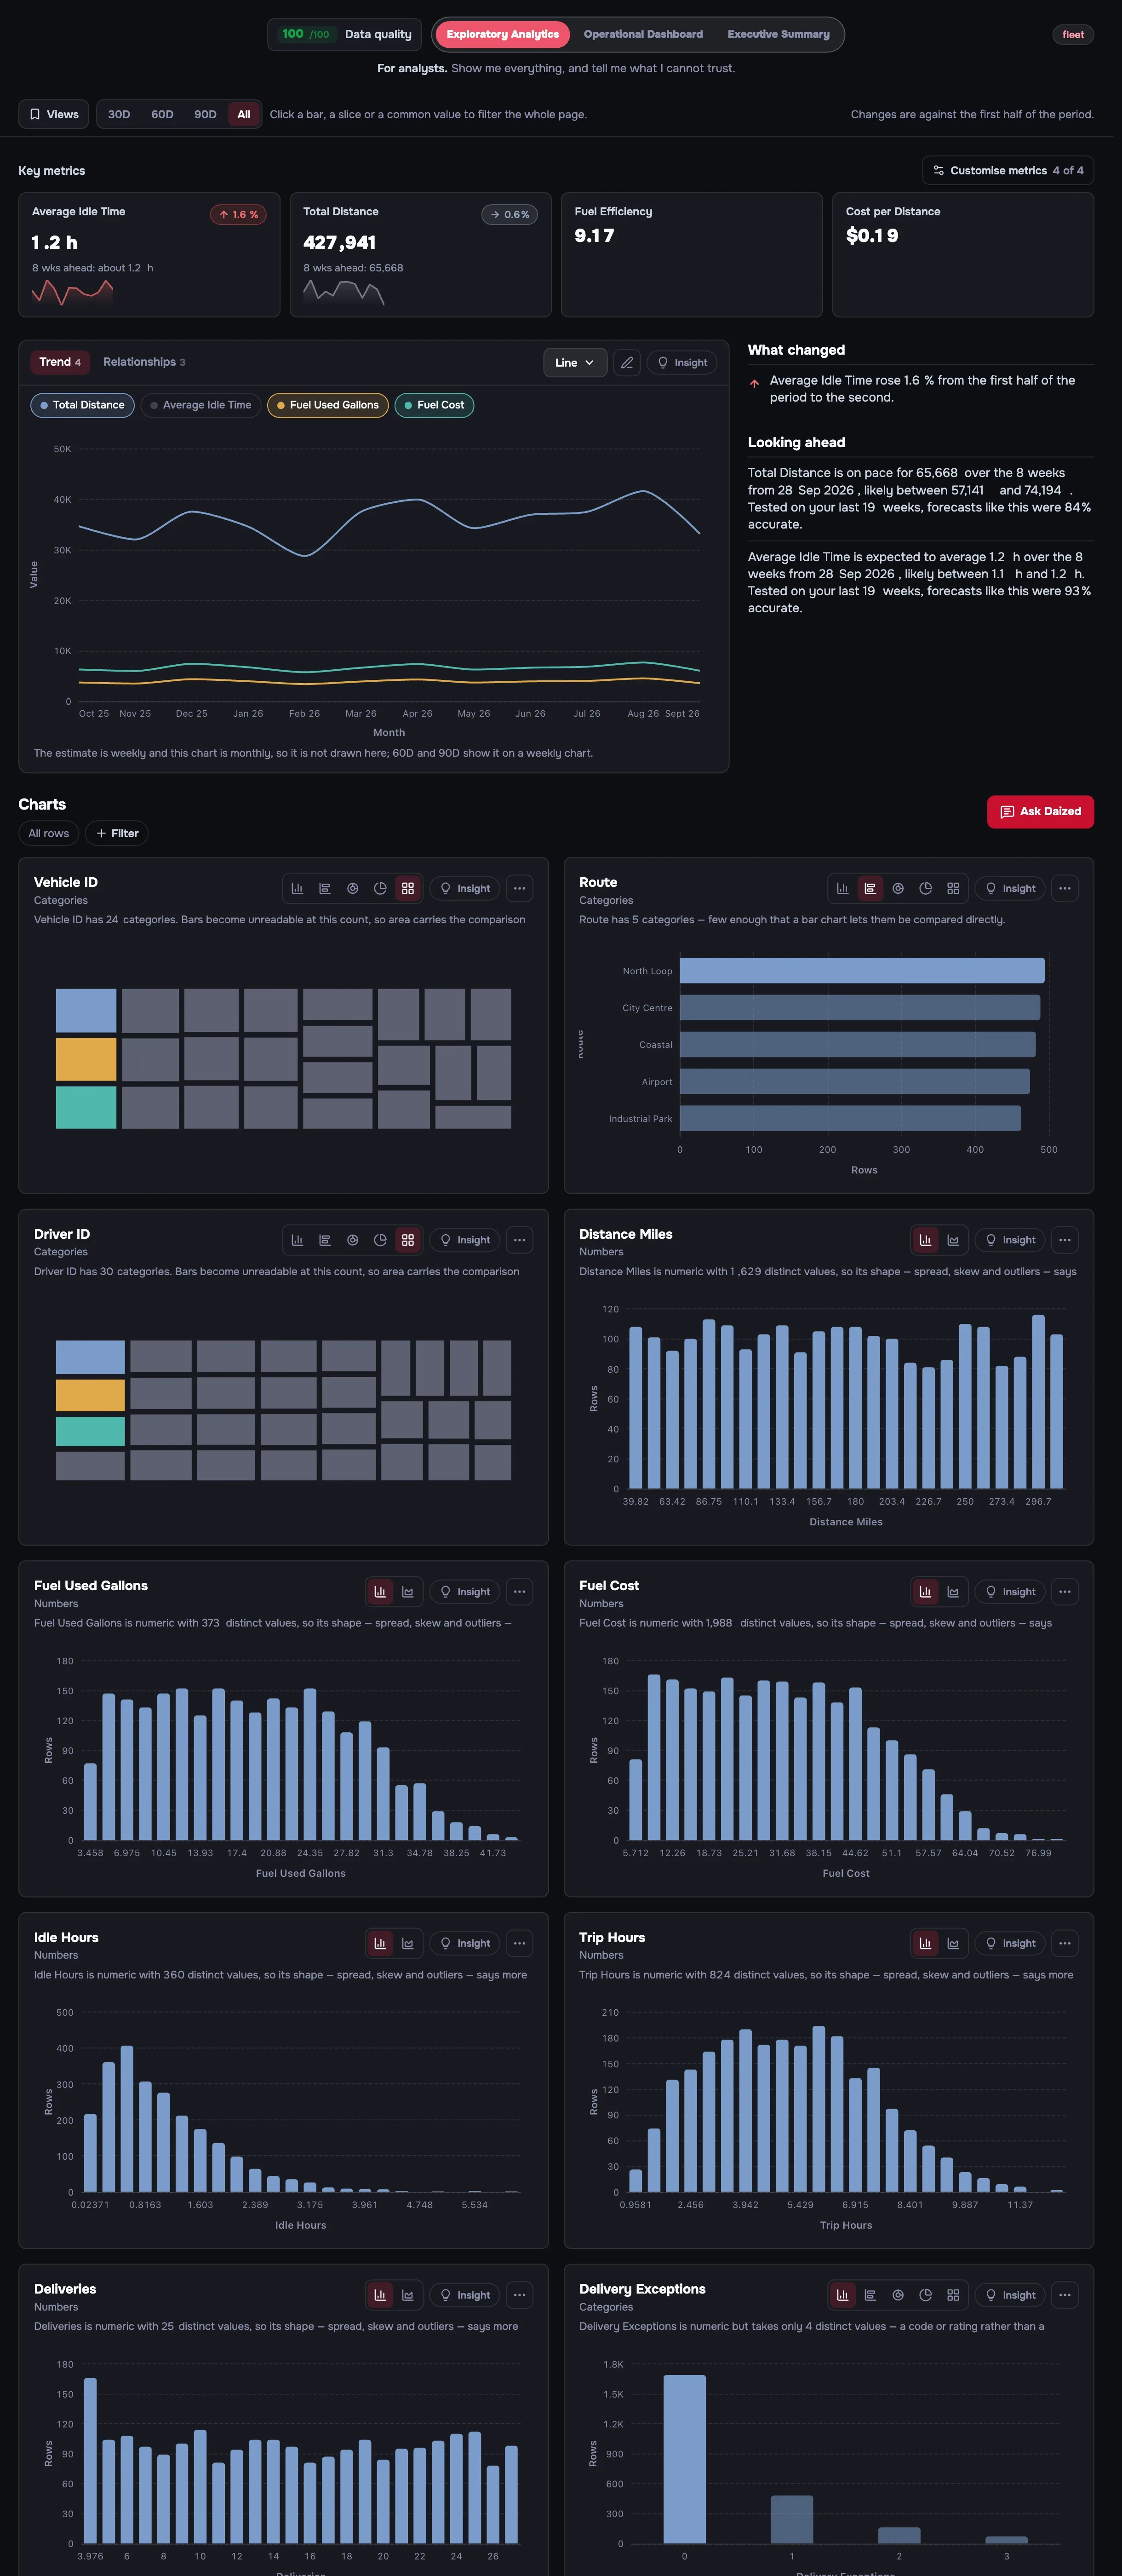
Each dashboard was made by Daized from the sample file named above it, exported from the product as it is.
What it needs from you
A file exported from wherever your numbers live today. Nothing to prepare.
- File types
- CSVTSVTXTXLSXXLS
- Size
- Up to 100 MB a file.
- Layout
- One header row, then your data. Title rows above the header are fine; Daized finds the real one.
- Column names
- Anything. Their meaning is worked out from the values, so nothing needs renaming.
- Not yet
- PDFs, images, JSON and Google Sheets links. Export them to CSV first.
Start free. Keep it if it reads your data right.
- 10 dashboards a week, free
- Every metric, chart and insight
- Ask Daized in plain words
- Share as PDF, image or HTML
No card. No trial clock. Upgrade only when you need more.
Have an account? Sign in